Real science shows US 2017 CO2 emissions had steepest drop in the world
America’s per-capita CO2 emissions are lowest in nearly 70 years.
A new analysis from the June 2018 BP Statistical Review of Global Energy has some intriguing details on the annual emission of carbon dioxide (CO2) in 201.
The global CO2 emissions from energy in 2017 grew by 1.6%, rebounding from the stagnant volumes during 2014-2016, and faster than the 10-year average of 1.3%. However, despite the dire predictions of extinction-causing climate change after President Donald Trump nixed the American participation in the Paris Climate Accord, the nation’s C02 emissions plunged.
…Declines in CO2 emissions in 2017 were led by the US (-0.5% and 42 million tons, see chart above). This is the ninth time in this century that the US has had the largest decline in emissions in the world. This also was the third consecutive year that emissions in the US declined, though the fall was the smallest over the last three years.
…Carbon emissions from energy use from the US are the lowest since 1992, the year that the United Nations Framework Convention on Climate Change (UNFCCC) came into existence. The next largest decline was in Ukraine (-10.1% and 28.1 tons).
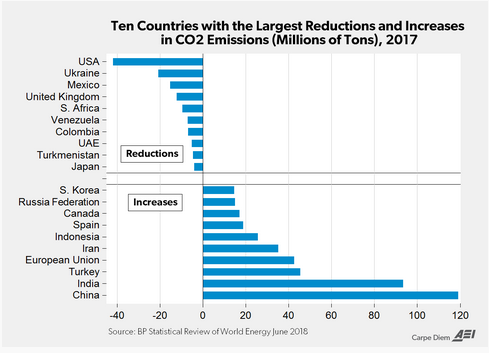
China and India’s C02 emission increased at the greatest rates because it was those countries who were poised to get the biggest breaks in the application of the Paris Climate Accord. Finally, it is with some amusement that I will note that EU emissions also increased, as this was from an analysis published just shortly before Trump’s withdrawal.
…However, China, India and the EU have indicated they will stick with the accord even if Mr Trump moves to withdraw the US.
Speaking to the BBC earlier, UN Secretary General Antonio Guterres said the accord would survive regardless of Mr Trump’s position.
Environmental groups like the Sierra Club said American withdrawal from the Paris accord would be a “historic mistake”, while Friends of the Earth said the move would “sacrifice our planet to the fossil fuel industry” and make the US the world’s “foremost climate villain”.
The topic of climate change is not featured as much in the elite media unless they need some #TrumpDerangementSyndrome-based click-bait to make the weather analysis a bit more dramatic. In part, it is because the result of the withdrawal has obviously not lived up to the hype.
Another data point the mainstream media has clipped out of its climate coverage: America’s per-capita CO2 emissions are the lowest in nearly seven decades.
The Energy Information Administration’s (EIA) latest energy report shows U.S. carbon dioxide emissions are the lowest they’ve been since 1992, and that per-capita emissions are the lowest since 1950.
The U.S. emitted 15.6 metric tons of CO2 per person in 1950. After rising for decades, it’s declined in recent years to 15.8 metric tons per person in 2017, the lowest measured levels in 67 years.
Is it any wonder then that another country is now tempted to withdraw from this agreement, which is nothing more than a carbon-based wealth distribution scheme?
Tony Abbott has called for Australia to withdraw from the Paris climate accord and torpedo the National Energy Guarantee, prompting some conservative colleagues to label the former prime minister an increasingly sad and isolated figure.
Mr Abbott, who as Prime Minister in 2015 committed Australia to reducing its greenhouse gas emissions 26-28 per cent by 2030, on Tuesday called for Australia to follow the lead of US President Donald Trump and abandon any official emissions reduction policy.
I hope we can soon welcome Australia to the League of Sane Nations, which would then have 2 members.
Donations tax deductible
to the full extent allowed by law.


Comments
An Inconvenient Truth you’ll never hear Al Gore talk about.
Al Gore is a scammer in the vein of Bernard Maddoff.
Gore belongs in the cell next to Maddoff’s.
This is way more inconvenient.
What are the photon absorption bands of CO2?
What are the photon absorption bands of water vapor?
What is the overlap?
What does it mean?
Absolutely correct. Once the CO2 has snagged all the energy in it’s absorption spectrum, adding more CO2 does not absorb any more energy.
If it’s raining, the longer you stay out, the wetter you will get. If it is raining and you fall into a river, when you get out the rain won’t make you any wetter,no longer how long you stay in it.
Tell that to the ignoramuses making ‘global warming’ a religion.
Also tell them about the world’s pollution being created by China, India – along with the world’s ocean plastic pollution created by China, India and Africa.
They’ll say: “How do you know?”
Fracked Natural Gas.
Natural gas from fracking is replacing both Coal and Fuel Oil. And, that is cleaning up the air.
NY, MA and other states are making Fracking against the law.
they cannot escape the laws of supply and demand
I’d like to know where these numbers would be if major western powers remained committed to Gen IV nuclear.
While I do agree that the Paris agreement was a complete joke and involved the US sacrificing economic growth for NO scientific purpose, you’ve got to be cautious about only using a graph like that.
It only shows increases and decreases – not what the actual base values are.
If, and I’m not saying this is the case, but IF the US were at a base level of 1,000, and we reduced per the graph by -40, while China was at 500, and increased by 120, then the US would still be at 960 and China is at 620 so they would still be significantly lower.
Again, I’m NOT SAYING that is the case, I pulled those numbers out of my ass to illustrate the point.
Always make sure when talking about increases and reductions to have a clear indication of what the base values are.
I think you missed the point.
Easy enough to do: https://www.bp.com/en/global/corporate/energy-economics/statistical-review-of-world-energy/downloads.html
A complete data set is here from 1965 onward.
USA 2017: 5087.7 million tonnes CO2 emitted
China 2017: 9232.6 million tonnes CO2 emitted
Total Europe: 4060.6 million tonnes CO2 emitted
India: 2344.2 million tonnes CO2 emitted
Glad we left that boondoggle behind us.
Global Warming has been revealed as a farce. Their computer models were broken, overestimating the climate’s sensitivity by a factor of 3.
The skeptics (ie real scientists) were proven right – yes the earth has been warming, but human influence has been barely significant and the projected warming is exaggerated.
Unfortunately, the reputation of Science in general has taken a huge hit. Anyone paying attention is now well aware that scientists will cheat the scientific method for a “noble”. They are not the objective uncorrupted paragons of Reason we were led to believe. In time that poor reputation will improve, hopefully at little cost to humanity.
The only uncertainty that remains is how the Climate Alarmists will retreat from the issue to save face. My money is they will a) revise history to claim they never said or did the perverse things they did and b) offer a truce that will stop the bleeding.
I say no. Remember that they likened your good faith skepticism to Holocaust Denial. Hound them to the ends of the Earth. “Round the moons of Nibia and round the Antares maelstrom and round perdition’s flames”
“Global Warming has been revealed as a farce. Their computer models were broken, overestimating the climate’s sensitivity by a factor of 3….”
Yes, it’s a farce. But computer models weren’t ‘broken’ any more than any democrat media news outlet is ‘broken’ for spreading lies.
The computer models were faked.
They got the climate sensitivity totally wrong. CO2 is inconsequential.
What are the photon absorption bands of CO2?
What are the photon absorption bands of water vapor?
What is the overlap?
What does it mean?
Darn. So that’s why the grass in my back meadow is turning brown. Of course, it could also be that it’s summertime in Texas.
Climate accord?
We don’t need no stinking climate accord!
No, Australia is (unfortunately) not tempted to follow the US’s lead, and is not considering it at all. Tony Abbott is (again, unfortunately) very much a former prime minister, a has-been, and as you yourself quote, his call prompted “some conservative colleagues to label the former prime minister an increasingly sad and isolated figure”. His replacement, Malcolm Turnbull, is a true believer in global warmening, and nothing will persuade him to follow Abbott’s good advice.
Fine, so our CO2 emissions are down, which would be wonderful if CO2 were actually harmful. But it isn’t, so a drop in emissions is kind of interesting news but not of any particular significance. It’s not bad news, but it’s not good news either.
A decline in CO2 is bad news for plants.
“A decline in CO2 is bad news for plants.”
WHY?
you do realize when the sun goes down, plants are just like all other living things on planet earth, the take in oxygen and give out CO2. the only time they need CO2 is during photosynthesis.
You have that exactly backwards. Plants absorb CO2 and release oxygen. Some commercial greenhouses pipe in CO2 to increase plant yield.
Plants absorb CO2 and release oxygen.
Not at night, they don’t.