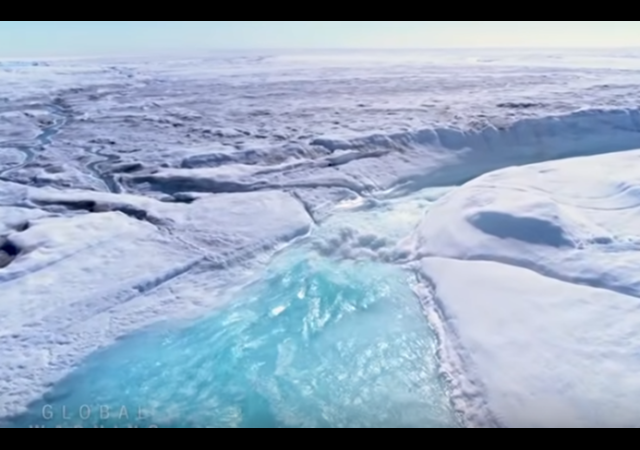
Shocking Video of Melting Greenland Glacier….in Summer Heat
Meanwhile, Antarctica’s Ross Ice Shelf is freezing…unexpectedly.
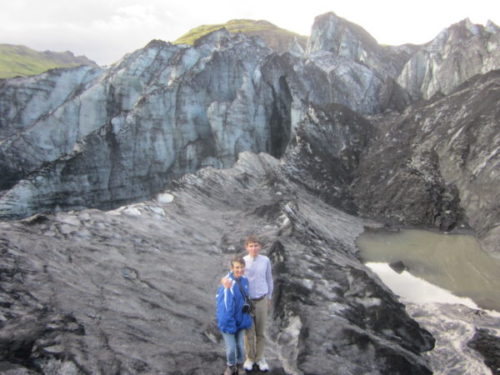
During my family vacation this year, we stopped in Iceland for a few days. The country was spectacular, and one of the memories I will cherish is our hike to the Solheimajokull Glacier.
While hiking, I noted the glacial lake and the signs warning visitors to be worried about calving, especially during summer months. Overall, it was a worry-free day of quality family time.
Interestingly, climate expert Antony Watts recently discussed an expanding Icelandic glacier, and its growth is dependent on precipitation.
In Iceland, glaciers are dependent on precipitation. And changes in the North Atlantic Oscillation could easily explain the change in precipitation. In a recent story from NASA’s Jet Propulsion Lab, scientists were “shocked” to find the previously shrinking Jakobshavn glacier in Greenland growing again.
“At first we didn’t believe it. We had pretty much assumed that Jakobshavn would just keep going on as it had over the last 20 years,” said Ala Khazendar of NASA’s Jet Propulsion Laboratory.
Meanwhile, in Greenland, a similar scene triggered some “climate change” hysteria.
This is a roaring glacial melt, under the bridge to Kangerlussiauq, Greenland where it’s 22C today and Danish officials say 12 billions tons of ice melted in 24 hours, yesterday. pic.twitter.com/Rl2odG4xWj
— Laurie Garrett (@Laurie_Garrett) August 1, 2019
Of course, America’s Green Justice Princess had to chime in:
This is what sea level rise looks like.
Those who argue that a #GreenNewDeal is too ambitious don’t see that glacial melt isn’t waiting – in fact, it’s happening at a much faster rate than predicted.
We don’t have time to argue. We need to act – on a massive scale. ? https://t.co/VbpT1sCudq
— Alexandria Ocasio-Cortez (@AOC) August 2, 2019
Ocasio-Cortez was not the only one ginning up “climate crisis” fear over melting ice.
A massive heat wave has caused the Greenland ice sheet to melt at rates not projected until 2070.
We are in a climate emergency. Vote accordingly. https://t.co/GqrPhh1HlY
— Hillary Clinton (@HillaryClinton) August 3, 2019
Fortunately, some people brought some much-needed perspective into the discussion.
It’s frightening what’s going on! Just look what’s happening to the Perito Moreno Glacier in Argentina…
…
Oh, wait- it isn’t frightening: this happens every year as summer temps approach and freezes again when winter ones come.https://t.co/86YOZu8dF7 pic.twitter.com/YuNR3uID8H
— Patrick (@ArgentineTea) August 2, 2019
Furthermore, for those claiming that the Arctic Circle has never been this warm, historical data indicates that extremely high temperatures previously came in 1927.
The Arctic was on fire in 1927 with 90+ temperatures. Pine forests need fire to regenerate. It is easy to become alarmed about ordinary phenomena which you are unfamiliar with. pic.twitter.com/qWTvIKtyow
— Steve Goddard (@SteveSGoddard) August 2, 2019
Finally, in Antartica (which is now experiencing its winter), a deep bore probe of the Ross Ice Shelf finds freezing ice, not melting as expected.
The surprises began almost as soon as a camera was lowered into the first borehole, around December 1. The undersides of ice shelves are usually smooth due to gradual melting. But as the camera passed through the bottom of the hole, it showed the underside of the ice adorned with a glittering layer of flat ice crystals—like a jumble of snowflakes—evidence that in this particular place, sea water is actually freezing onto the base of the ice instead of melting it.
“It blew our minds,” says Christina Hulbe, a glaciologist from the University of Otago in New Zealand, who co-led the expedition.
I must note that there are real hazards associated with melting glaciers ….just not the ones “experts” care to discuss.
The bodies of three boaters from Europe who died in an Alaska lake were surrounded by frozen debris, a sign that the victims were killed by ice that fell from the melting glacier that feeds the lake, officials in the city of Valdez said on Thursday.
…The victims were identified as Manfred Brida, 62, of Austria, and Maria Elisabeth Schroer, 68, and Albrecht Paul Thomas Schroder-Shroer, of Germany.
The three had been boating in an inflatable canoe-type craft, which was recovered from the scene, along with the victims’ other belongings. The bodies were discovered Tuesday morning by kayakers.
Donations tax deductible
to the full extent allowed by law.


Comments
Also, a NASA study determined (among other very interesting things) that there is a very large aquifer under Greenland that accounts for most of the glacier melting and that it accounts for most of the annual shrinkage, not global warming nor changes in the ocean currents.
https://www.ted.com/talks/kristin_poinar_what_s_hidden_under_the_greenland_ice_sheet
Also, there is a cycle of warming and cooling related to that aquifer that is triggered by water pressure that regulates the water temperature.
Pasadena Phil: {cites Kristin Poinar}
Why is the ice melting? Because, according to Poinar, the Earth is warming. She is discussing up to a one meter rise in sea levels by the end of the century due to global warming. While her specialty is glacier melt, her stated purpose is to help “policymakers and stake-holders make informed decisions on the growing number of issues that climate change and sea-level rise affect.”
See also, Poinar et al., Limits to future expansion of surface‐melt‐enhanced ice flow into the interior of western Greenland, Geophysical Research Letters 2015: “As the climate warms, melting is increasing at higher elevations (farther inland) on the ice sheet surface. An outstanding question is whether this surface meltwater can access the bed through moulins, and if so, whether the seasonal melt‐induced speedup that presently occurs at lower elevations will be observed at new inland locations… Overall, in the next several decades, the inland migration of melt is unlikely to produce large changes in flow due to increased basal lubrication or the thawing of a frozen bed.”
We have pointed this out to you previously.
(“We”?) And I have corrected you regarding what her stated purpose for engaging in this study vs the results. You are just cherry-picking points and twisting them to make ill-informed YOUR point. Yes, the earth has been warming for 12,000 years. Yes, Greenland contributes some to the rise in sea levels. But as she points out, most of the melting is due to, now pay attention… are you paying attention?…. write this down: the cyclical heating up and cooling down of that aquifer system.
Also, being how her funding is dependent on her reciting the global warming shibolleth, of course she is going include some wording regarding global warming. But at no point does she attribute the 12,000-year warming to man-made causes. Are you paying attention? Hello? Is anybody home?
Pasadena Phil: Yes, the earth has been warming for 12,000 years.
Poinar specifically notes that increased melt is due to the warming Earth. She finds that the melt is over decadal time periods, and not just seasonal. You had said otherwise.
Pasadena Phil: But at no point does she attribute the 12,000-year warming to man-made causes.
She says, “as the climate warms”. According to researchers in the field, continued warming is expected to continue due to anthropogenic emissions of greenhouse gases, and positive forcings, including ice melt.
Pasadena Phil: Yes, the earth has been warming for 12,000 years.
To be more accurate, the Earth warmed until about 8 thousand years ago, then started to cool somewhat. There has been a sudden warming over the last few decades.
Pasadena Phil: write this down: the cyclical heating up and cooling down of that aquifer system.
Kristin Poinar: “We never thought that an ice sheet could lose mass into the ocean this quickly. Since these measurements began in the ice sheet has lost so much ice that if that water were piled up on our smallest continent it would drown Australia knee-deep.”
Archaeologist have discovered the remains of many villages in Greenland that date back to pre-Viking days. It revealed farming and raising cattle/livestock. If this is the case then getting back to “Normal” is what is happening there. While our climate Nazi’s think that our current period is the correct one history tells us just the opposite.
We’re still in the grip of an ice age. Normal for earth is ‘no summer ice’. I don’t think any human has ever seen ‘normal’.
The difference between observational scientists and experimental scientists is that observational scientists will say, “Oh, look! We have new pictures!!!!” and the experimental scientists will say, “has this happened, before?”
From observational scientist to reporter is a big leap in understanding, and reporters have a bad habit of deleting all of the clarifying information, in favor of an interesting or clickbait headline.
I remember the adventures of those people claiming that there is a “garbage patch” in the ocean, a “Sargasso Sea” of trash in the pacific, the size of the United States. A ship set out to collect some garbage, and they took along straw bales to make floating displays of what little plastic they found. That’s right, they dumped trash in the ocean to prove there was trash in the ocean. Now they are focused on microscopic bits of plastic, and dredging up old nets. I wonder how much damage they do, by pulling up half-buried garbage from the ocean floor.
I also remember all the “climate change” graphs that are so-o-o-o simple because they left off the error bars. Error bars would make the magnitude of the changes reported look like the trifling amounts they are.
Then there were the too-cute-for-words choices about where to start the “climate change” temperature graphs, so that past lows and highs from the very long geographic scale were left off, magnifying the direction and significance of temperatures.
The corker, though, was the admission that the worst of the alarmists could not retrieve their own original data. For my clients, the data in a paper can be back-calculated from the reported data points and disclosure of any calculations. That this important step was missing is analogous to breaking the chain of custody in a criminal case.
This is what happens when scientists engage the scientific process. What passes as science these days is “scientism” which is where people claiming to be scientists present their personal opinions driven by political forces as science.
BTW, Antarctica has large active volcanoes and a massive fresh water lake under the ice.
Pasadena Phil: Antarctica has large active volcanoes and a massive fresh water lake under the ice.
Gosh. What will those crazy scientists come up with next?!
Valerie: I also remember all the “climate change” graphs that are so-o-o-o simple because they left off the error bars.
All scientific studies show error bars. GISTEMPv4 from 1950 to present is 0.147 ±0.018 °C/decade (2σ). Climate sensitivity per doubling of CO2 is likely 1½-4½°C , and very unlikely to be below 1½°C, though there is less certainty about the upper limit.
Valerie: The corker, though, was the admission that the worst of the alarmists could not retrieve their own original data.
The raw data was always available, though difficult to acquire, but is now easily available.
Ice cap mass over time:
https://www.giss.nasa.gov/research/briefs/hansen_15/fig2.gif
Gee, I wonder why the X and Y axes are scaled the way they are in that graph.
Paul: Gee, I wonder why the X and Y axes are scaled the way they are in that graph.
Because the axes make sense to show change in ice mass.
Here’s somewhat more recent data: “Change in the total mass (in Gigatonnes) of the Greenland ice sheet between April 2002 and June 2017, estimated from GRACE measurements”
https://arctic.noaa.gov/Portals/7/easygalleryimages/8/367/tedesco-fig3.png
Of course! The NOAA! The same corrupt government agency that was busted recently for falsifying data! Zachiel, you keep citing data from the same old discredited sources every time we talk about this. Are you living in solitary confinement on an island somewhere?
Pasadena Phil: The NOAA! The same corrupt government agency that was busted recently for falsifying data!
The chart is based on independent studies; Sasgen et al., Greenland Ice Sheet, Arctic Report Card; Velicogna et al., Regional acceleration in ice mass loss from Greenland and Antarctica using GRACE time‐variable gravity data, American Geophysical Union 2014. These studies combine the efforts of scientists from many different countries.
This is stronger evidence than you saying “Is not!”
That isn’t over time, that’s over less than an eyeblink.
txvet2: That isn’t over time, that’s over less than an eyeblink.
Um, perhaps you have a different definition of time than everyone else. Perhaps you mean it’s not over geological timescales. But we don’t expect human influences to have operated over geological time. What the graph shows is satellite data. The hypothesis was that the ice caps would be losing mass, and that is what is observed. That doesn’t “prove” global warming, but is one more piece of evidence supporting the hypothesis. Now, add in data from surface stations, satellites, balloon radiosondes, ocean buoys, and we have a much better picture, a picture that is consistent with greenhouse warming.
Oh that’s right we all forgot about the surface data! You know the ones that neighborhoods have grown up around or the one on top of high rises where the large water cooled A/C towers are right net to them. The ship born sensors that are corrupted by the discharges from the ships and the wonderful satellites that show them what they want to see and not what’s there. The core plug data from the Antarctic show 180 degree temp changes of millions of year before the first internal combustible engine was invented. Then we have the “Hockey Stick” that tried to make a smidgen of time in the Earth’s history look like it was a big deal when it was a flea fart in size when compared to our planet’s age. You climate Nazis have been predicting doom for years and it hasn’t and will not come form climate change.
inspectorudy: we all forgot about the surface data! You know the ones that neighborhoods have grown up around or the one on top of high rises where the large water cooled A/C towers are right net to them. The ship born sensors that are corrupted by the discharges from the ships and the wonderful satellites that show them what they want to see and not what’s there.
Ah, yes. All the data is wrong, even though it is collected by different scientists using different methods. Modern ocean buoys that show oceanic heat content increasing are wrong too, because, well, “Is not!”
Leslie, I challenge you to pronounce “Solheimajokul”. Never get lost in Iceland. Even if you know where you are trying to go, it’s a bet you can’t pronounce it. How ironic that they settled for a simple name like Iceland. Unpronounceable names for everything must be their national defense policy.
In icelandic, the name is ‘island’. I figure after sailing so long they asked “should we stop here?” and the answer was “it is land.”
The sky is falling!! The sky is falling!! Vote accordingly!!!
Physical and thermal stress are mechanism in a recurring natural cycle of reduce, reuse, and recycle of water and ice.
Melting glacier in summer. What a surprise.
When they don’t melt we have an ice age. We’re not in an ice age. Ergo, glaciers must be melting in some places while they accumulate in others. The accumulation part is boring; just compacted snow, and it’s like watching paint dry. Running water, though, looks good on video.
What I do find alarming is that these twits at JPL and Otago find the bloody obvious to be such a surprise. They really should know their jobs better. Really. In my professional dealings with JPL I can’t say I’ve ever been knocked out, and I’ve never heard of U. Otago, but the professed shock that the laws of nature are not verifying warmunist doctrine should get them drummed out of the corps.
Interestingly enough, in her dim way, Psycho-Chick is onto something, with her “This is what sea level rise looks like.” Actually, there’s nothing that looks like sea level rise quite like . . . sea level rise. So look at it. Not glaciers, not tree rings, none of that hooey. Sea level is right in front of you, so it’s easy to see what it’s doing. So measure it yourself. That’s what “science” is; have a question about the operation of the sidereal universe? Don’t ask the Pope, don’t see what Aristotle had to say about it, don’t listen to some PR drone at NASA or NOAA—measure it yourself—that, and that alone, is what makes it science. Anything else is mere faith, or an appeal to authority, but certainly not science.
tom_swift: —measure it yourself—
Sure. See See Nerem et al., Climate-change–driven accelerated sea-level rise detected in the altimeter era, PNAS 2018.
Meanwhile, other scientists measure the ice caps and show that they are losing mass, consistent with warming detected by surface stations, satellite observations, and ocean buoys. So we have a wide variety of different observations that support global warming.
Sure. See See Nerem et al.
No, measure it yourself.
Science is like that. The same for all observers. If you’re not an observer yourself you’re just along for the ride.
So we have a wide variety of different observations that support global warming.
As even AOC seems to realize, in her fuzzy sort of way, that’s not sea level. No proxies needed, sea level is easily measured and nobody needs a government grant to do it. So do it. Measure first, sound off later.
tom_swift: No, measure it yourself.
They’re working directly from observations, data collected over 25 years with four different satellites. You do understand that nearly all modern science makes observations through instrumentation? Not sure what else you think has to happen.
Dummy, you forgot the earth has its own plan. It’s called and Ice Age.
<b.TheFineReport.com: you forgot the earth has its own plan.
Ah, élan vital. Nonetheless, a sentient Earth still obeys the laws of physics. The cycle of ice ages is due to orbital variations, amplified by the greenhouse effect and changes in albedo.
Can we just send all the liberals to a safe zone…..say Venezuela? With their decrease in fossil fuel usage I’m sure it’ll be one of the few habitable places left on Urf.
I’ll just note here that Zachriel is a paid commie commenter, paid to spread lies.
Let’s be very clear. The commies cannot show global warming with the data, so they write algorithms to produce the result they want from the raw data. They will not publish these because if they did people like me would find the magic numbers in 30 minutes or less.
It’s all a scam, and comrade Zach is a scam artist.
Ever been to Daytona? Miami? San Francisco? Los Angeles? Galveston? Charleston? Norfolk? New York?
All still there and not one under water.