April, the month when the sting of the government’s overreach is most acute, provided the backdrop for a series of infographics illustrating just how onerous the tax burden (and fiscal irresponsibility) is to our country. Groups like the Cato Institute, AFP, Illinois Policy Institute, and the Heritage Foundation all found ways to capture the mounting tax burden. Which you do you think is the most effective? Vote here.
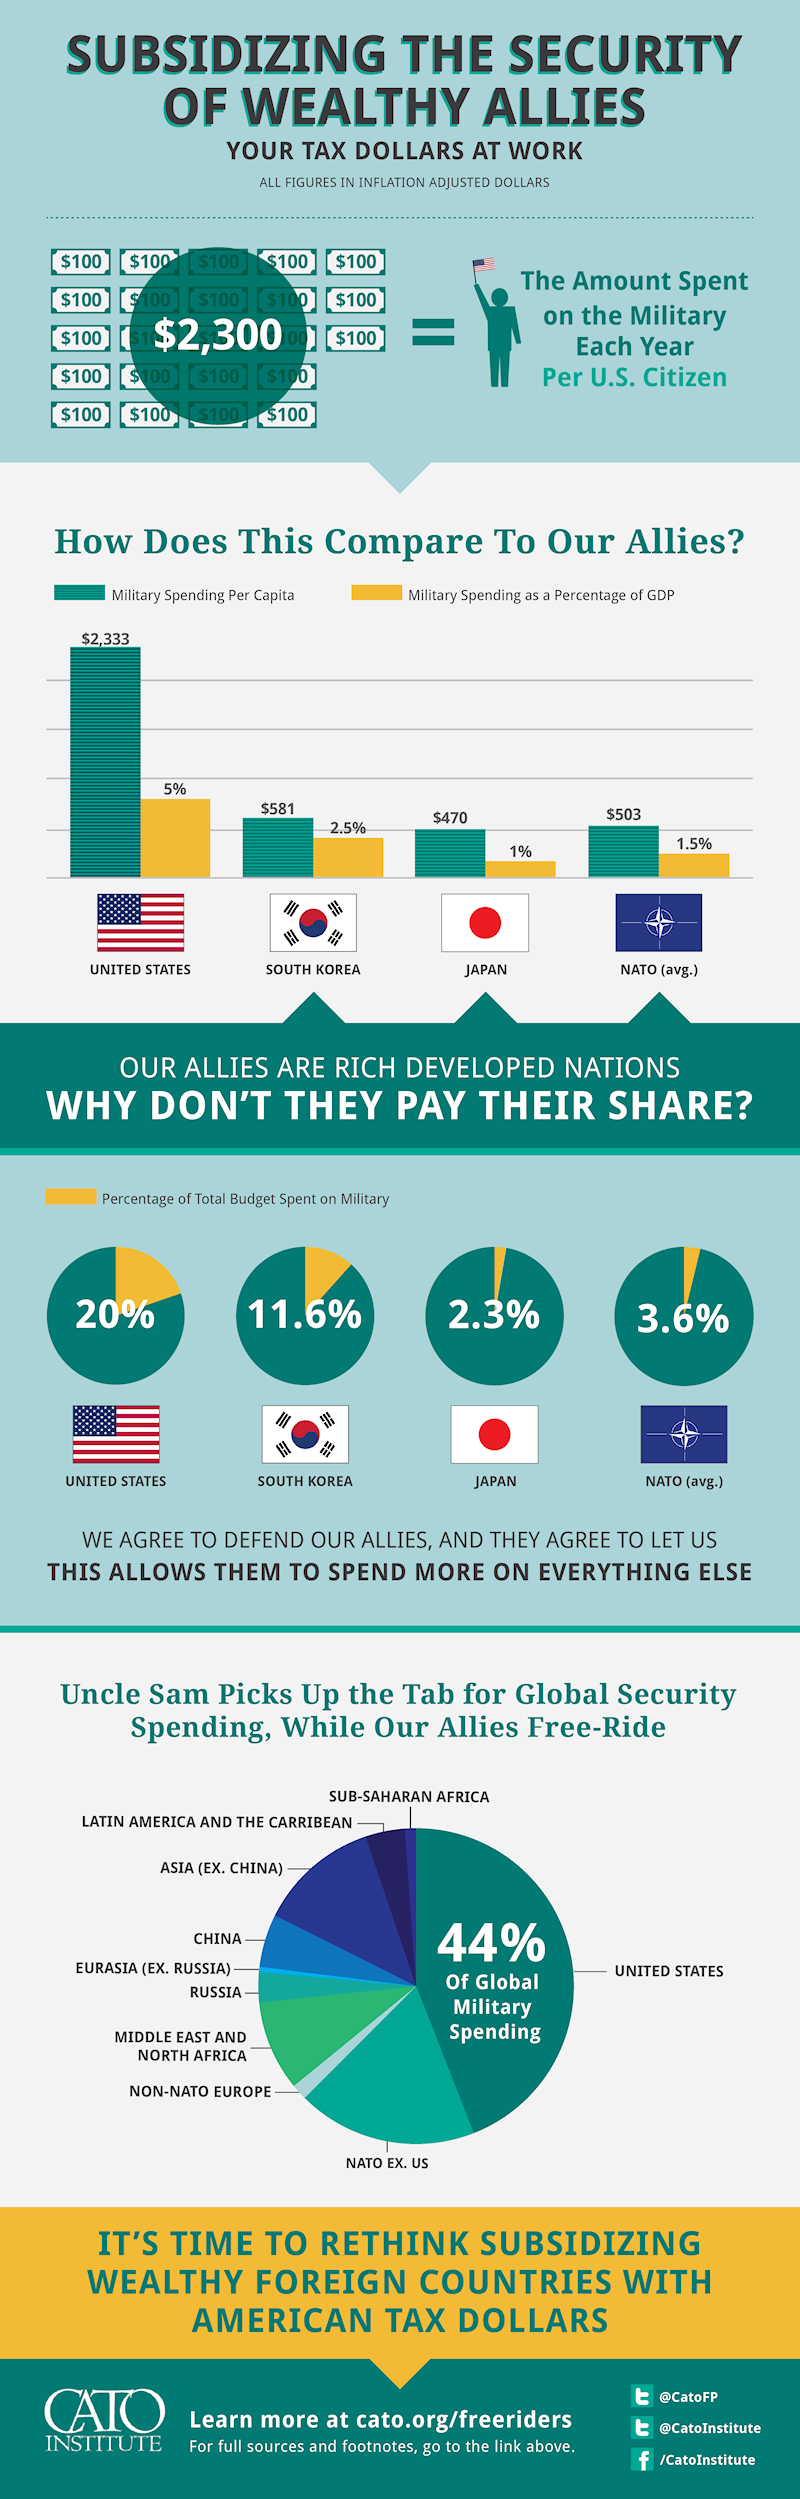
Cato Institute, “Subsidizing the Security of Wealthy Allies”
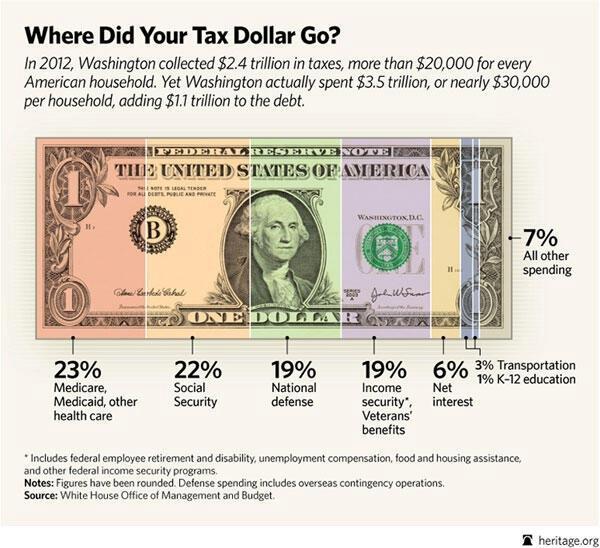
Heritage Foundation,”Where Did Your Tax Dollar Go?”:
Illinois Policy Institute, “Keep Calm and Continue Borrowing”:

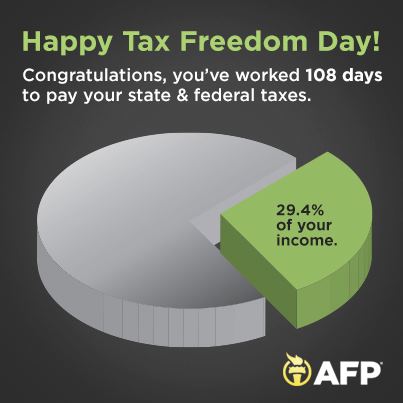
Americans for Prosperity, “Happy Tax Freedom Day”:
FreeEnterprise.com from the Chamber of Commerce, “Happy Tax Freedom Day”:

Donations tax deductible
to the full extent allowed by law.


Comments
Four words you don’t hear anymore: It’s a free country.
These graphs highlight the economic aspect to that loss of freedom. The more the Feds take from anyone–rich or low income–the less freedom for everyone.
Add to this the ramming through the Senate of the so called “tas equalization” bill which will place an undue burden on internet purchases.
Anyway to get their grubby hands into your pocketbook!
Just another spiral downward with regard to the quality of life under the anointed one…
Yes, the “marketplace fairness act” right out of Atlas Shrugged. Why not just be honest and call it the “bend over act”.
On top of that, property taxes are going up, either through tax rates or reappraisals.
Last year Metro Nashville Davidson County popped a 12% property tax increase. This year, with the help of the INTERNATIONAL ASSOCIATION OF ASSESSING OFFICERS (first county in Tennessee to use their services), is calculating reappraisal based on council districts.
Although property values tanked in 2008 and have NOT risen, the INTERNATIONAL ASSOCIATION OF ASSESSING OFFICERS, deems values have risen 5-6% in my council district. No data as to how other council districts’ values have been raised or lowered.
Sounds like an OPAQUE WAY to redistribute property taxes.
Because if it wasn’t for BusHitler your property values would have gone up a billion percent. You should be thanking your betters for the tax cut. Now shut up!!!!
Looking at where our money is being spent, you’ll note only about a third of federal dollars are spent on things the government has the constitutional authority to spend on…
Went to the “polling place,” didn’t vote. They’re all terrible; every one of them misses the point completely – government spending, the Bernanke printing press, and debt. This is a poor showing, an unimaginative group in a target rich environment. I hope they didn’t pay much for them. Comments there are disabled, so I’ll make them here.
The Chamber of Commerce and AFP presentations are tired, old, and worn out. We’ve been seeing them for generations; they hardly even prompt a sense of outrage anymore, much less shock.
Cato’s is annoying. It trundles out one of their ancient, old bug-a-boo gripes. History and politics make comparisons with Japan and South Korea disingenuous. And NATO? Well, one supposes our new “lead from behind” philosophy might stir their defense instincts, but then, they do have retirement and vacation obligations, you know.
The Illinois Policy Institute has the right idea; again, it’s the same old words with nothing memorable to stir the senses.
The Heritage image is one more boring, static, graphic presentation of spending. A major gripe with it, though, is lumping veteran’s benefits with income security, and calling them out, no less. The argument for doing so is understood, but it’s misleading and the sentiment it inspires is misplaced.
A graphic presentation of the threat posed by the breadth and depth of our financial problems, and our government’s grubby financial practices may exist, but it isn’t here.
[…] There’s more. Legal Insurrection posts several graphs depicting our national debt crisis and invites you to vote on your favorite. https://legalinsurrection.com/2013/04/war-of-the-taxpayer-shakedown-infographics/ […]