A series of graphs demonstrate just how disastrous the Obama (failed) Recovery has been for our country, made all the more stark when compared to prior post-war “recoveries.” Jacob Goldstein writes on the NPR blog that while this first chart, produced by the blog Calculated Risk, is scary:
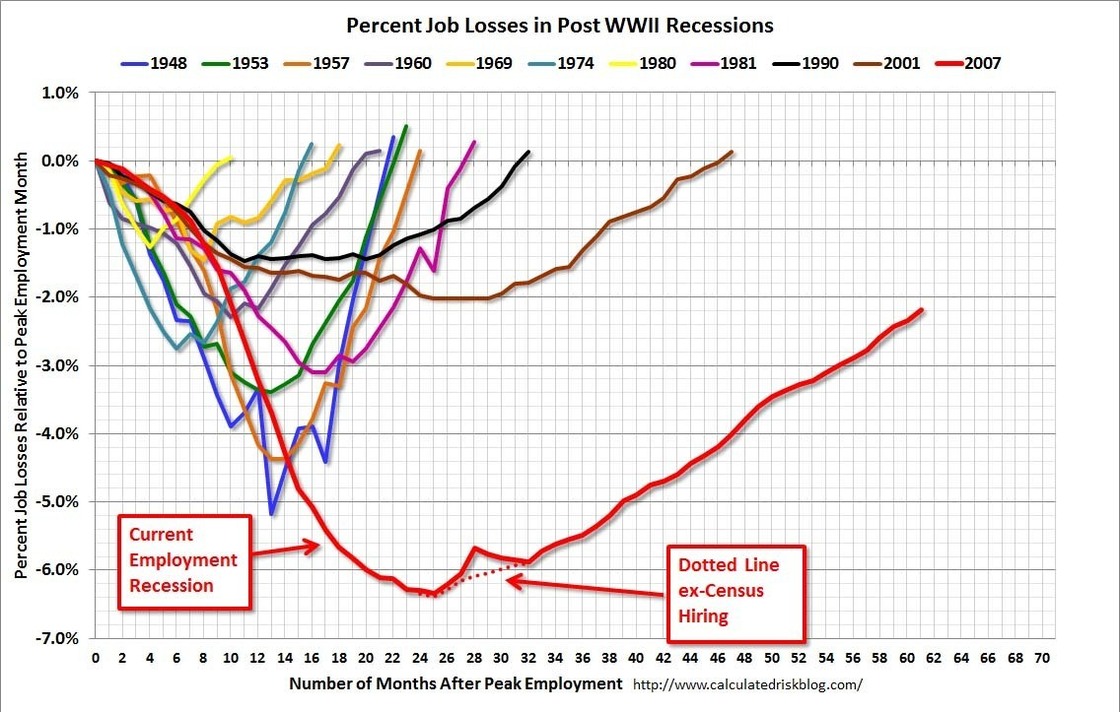
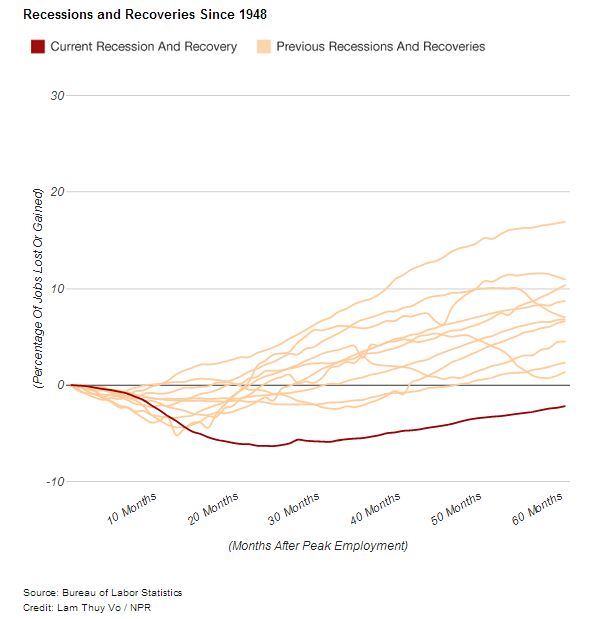
…But it isn’t “scary enough.” He then produces this graph, which illustrates the abysmal failure that is the Great Obama Failed Recovery (click for interactive version):
DONATE
Donations tax deductible
to the full extent allowed by law.


Comments
The greatest president evah. sarc/off.
Because George Bush.
Facts are racist.
Here is a plot with dates.
Oh my, the fact that employment started an immediate down turn upon Obama’s election may be a coincidence but I doubt it. Businesses generally see the hand writing on the wall better than the average voter.
You should look at that graph again or examine the top two tables here. In other words, peak employment happened on Bush’s watch.
I am willing to argue, and to point to data which imply, that Obama inherited a problem from Bush and made it worse. That’s not the same think as blaming Obama exclusively.
The path back to conservative victory does not lie in the Valley of Wishful Thinking.
Bush inherited problems from Clinton:
1. the dotcom bubble burst.
2. the weakened national security (e.g. “the Wall”) that allowed the 9/11 plot to develop and give a pounding to the economy.
3. the subprime mortgage mess, which he made efforts to fix through normal legislative channels but was thwarted, mostly by Democrats, including Obama.
In spite of all that, the Bush economy on average was much better than what we’ve had at any time since, and the big downturn came after Democrats took both houses of Congress.
Any halfway-informed Democrat knows at least some of those facts. But facts must yield to the script: “Bush is responsible for everything bad and for nothing good. Obama cannot possibly be responsible for anything bad, so the fault has to be with Bush or the Republican House.”
I suggest you reread the last two paragraphs of my post.
Not so much wishful thinking as I was thinking Obama started his presidency in 2008. It was 2009, so I stand corrected.
To Obama, it’s a great success: the Cloward-Pivin strategy is working.
The Cloward–Piven strategy is a political strategy outlined in 1966 by American sociologists and political activists Richard Cloward (1926–2001) and Frances Fox Piven (b. 1932) that called for overloading the U.S. public welfare system in order to precipitate a crisis that would lead to a replacement of the welfare system with a national system of “a guaranteed annual income and thus an end to poverty”.
http://en.wikipedia.org/wiki/Cloward%E2%80%93Piven_strategy
“The ultimate objective of this strategy — to wipe out poverty by establishing a guaranteed annual income — will be questioned by some” (say Cloward & Piven).
Yes, indeed. Some troglodytes will ask if they’ve thought of how they’re going to come up with the means to sustain all those guaranteed annual incomes at levels above poverty. Some will even have the temerity to point out that previous efforts along those lines have resulted in more poverty for everyone, except for the ruling clique that controls all the nation’s resources.
But wiping out poverty sounds so nice.
That NPR put this out is news in itself – a day late and a dollar short, or more accurately six months late and a few trillion short. This indictment of Obama’s (non-existent) leadership skills should have been put out there at least a year ago if not two years ago. Let us not forget that this is an indictment of Congress also.
So only the Great Depression exceeds this recession. Given Obama’s narcissism, I wouldn’t be surprised to see him go for the record.
This is a curious graph, however. Note that a recession that started in 1980 (Carter’s term) seems to recover, but overlaps or is immediately followed by a recession in 1981 (Reagan’s term). Any economist out there who can explain this to me? It is clear to me the graph is normalized to a specific beginning period, but I am not sure how this overlap period, if it is an overlap, is properly explained.
I see that the Obama Economic recovery has a -1 correlation to human flourishing. That’s because the Obama/Reich economic plan is to f*** the American people to “help” the American people.
Heck Anne, who cares about a failed recovery? We should be thrilled, excited, happy, ecstatic because, like some guy said — was it Jayzee or Jamie Foxx? — my president is black!
Economy?
Recovery?
Fuggedaboutdat! Look upon Barack’s café au lait and drown all America’s economic woes in that.
Come on folks! Did you miss the memo? These graphs should include the funemployed, Ophonies, and fOdstampers, that are doing just fine living off the hard working that still have a job.
I forgot to mention one point: while the elite of the left is seeking to impoverish the masses so as to provide them with a meager guaranteed living, they have no plan on joining the masses. Rather, they will be the future rich, much like the corrupt ‘green’ company Obama donors who have looted the US treasury with Obama’s help.