One of the puzzling things about the left’s enthusiastic embrace of the outright socio-cultural destruction of America has been why so many ordinary people go along with their intentionally divisive, radical socio-cultural agenda, either by shrugging and moving away from it (insulating themselves and their families in various ways), by seeing it and seething in silence, or by actually jumping on the handcart to leftist Hades.
YouGov has done some digging and has come up with part of the answer. The left’s constant haranguing on identity politics and their constant elevation of the loud tiny minorities they claim to “represent” has arguably skewed Americans’ impressions of the actual size of demographic groups. Obviously, this is done on purpose, with the help of the infotainment media and Big Tech speech and thought gatekeepers, and it’s been effective.
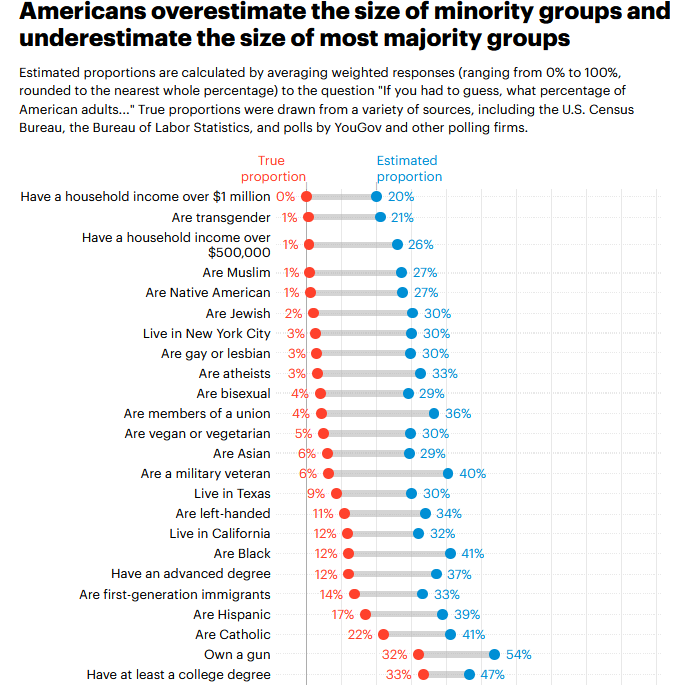
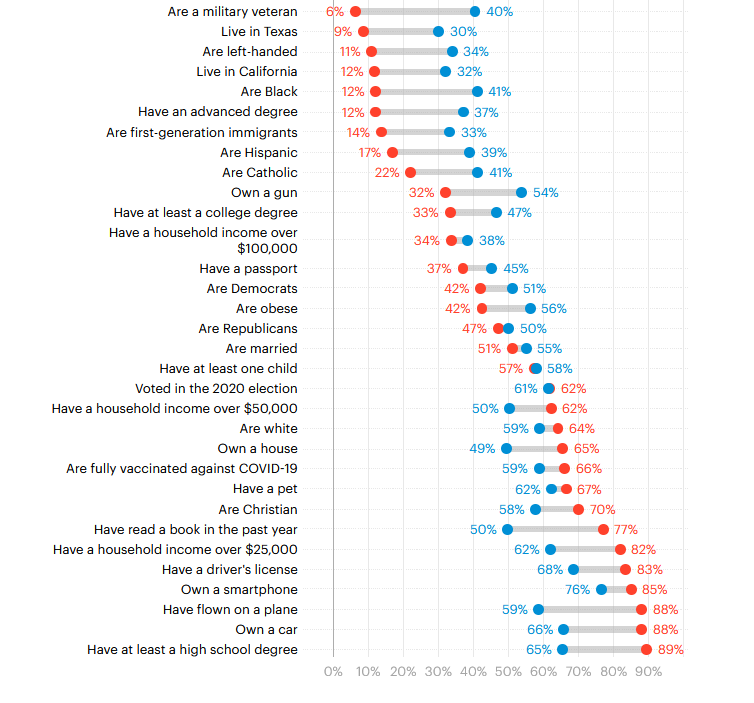
When it comes to estimating the size of demographic groups, Americans rarely get it right. In two recent YouGov polls, we asked respondents to guess the percentage (ranging from 0% to 100%) of American adults who are members of 43 different groups, including racial and religious groups, as well as other less frequently studied groups, such as pet owners and those who are left-handed.When people’s average perceptions of group sizes are compared to actual population estimates, an intriguing pattern emerges: Amercians tend to vastly overestimate the size of minority groups. This holds for sexual minorities, including the proportion of gays and lesbians (estimate: 30%, true: 3%), bisexuals (estimate: 29%, true: 4%), and people who are transgender (estimate: 21%, true: 0.6%).It also applies to religious minorities, such as Muslim Americans (estimate: 27%, true: 1%) and Jewish Americans (estimate: 30%, true: 2%). And we find the same sorts of overestimates for racial and ethnic minorities, such as Native Americans (estimate: 27%, true: 1%), Asian Americans (estimate: 29%, true: 6%), and Black Americans (estimate: 41%, true: 12%).A parallel pattern emerges when we look at estimates of majority groups: People tend to underestimate rather than overestimate their size relative to their actual share of the adult population. For instance, we find that people underestimate the proportion of American adults who are Christian (estimate: 58%, true: 70%) and the proportion who have at least a high school degree (estimate: 65%, true: 89%).The most accurate estimates involved groups whose real proportion fell right around 50%, including the percentage of American adults who are married (estimate: 55%, true: 51%) and have at least one child (estimate: 58%, true: 57%).
Here is part of YouGov’s chart:
Here is the full thing (in two parts, view it at YouGov here):
You can just hear the left screaming that these results “prove” white people feel “threatened” by minorities and that due to fear of minorities as a dire threat to their way of life imagine that there are more of whatever given group than there actually are. But that is not logical, nor is it what YouGov found.
YouGov continues:
Misperceptions of the size of minority groups have been identified in prior surveys, which observers have often attributed to social causes: fear of out-groups, lack of personal exposure, or portrayals in the media. Yet consistent with prior research, we find that the tendency to misestimate the size of demographic groups is actually one instance of a broader tendency to overestimate small proportions and underestimate large ones, regardless of the topic.If exaggerated perceptions of minority groups’ share of the American population are due to fear, we would expect estimates of those groups’ share that are made by the groups’ members to be more accurate than those made by others. We tested this theory on minority groups that were represented by at least 100 respondents within our sample and found that they were no better (and often worse) than non-group members at guessing the relative size of the minority group they belong to.Black Americans estimate that, on average, Black people make up 52% of the U.S. adult population; non-Black Americans estimate the proportion is roughly 39%, closer to the real figure of 12%. First-generation immigrants we surveyed estimate that first-generation immigrants account for 40% of U.S. adults, while non-immigrants guess it is around 31%, closer to the actual figure of 14%.Although there is some question-by-question variability, the results from our survey show that inaccurate perceptions of group size are not limited to the types of socially charged group divisions typically explored in similar studies: race, religion, sexuality, education, and income.Americans are equally likely to misestimate the size of less widely discussed groups, such as adults who are left-handed. While respondents estimated that 34% of U.S. adults are left-handed, the real estimate lies closer to 10-12%. Similar misperceptions are found regarding the proportion of American adults who own a pet, have read a book in the past year, or reside in various cities or states. This suggests that errors in judgment are not due to the specific context surrounding a certain group.
YouGov notes that views on issues related to demographic size are not necessarily affected by learning the actual numbers.
Does correcting misperceptions of group size change peoples’ attitudes on related issues? Current research suggests it does not. In a series of studies (one of which used a survey fielded by YouGov), political scientists John Sides and Jack Citrin attempted to correct inaccurate beliefs about the size of the U.S. foreign-born population, both subtly, by embedding the accurate information in a news story, and explicitly, by providing survey respondents with Census Bureau estimates. They found that while providing this information did somewhat improve people’s knowledge of the number of immigrants in America, they did not make people more supportive of immigration. that knowledge of the actual numbers don’t necessarily affect voter attitudes on issues.
I find this interesting. Setting aside the complicated issue of immigration because YouGov doesn’t seem to make a distinction between widely-supported legal immigration and leftist open borders policies that not only permit but encourage illegal immigration, it would seem that people would be less likely to embrace the destruction of their core values and American principles in the name of accommodating a tiny fraction of the population if they knew just how tiny it really is.
CLICK HERE FOR FULL VERSION OF THIS STORY