Meteorologists who examine their prognosticative skill often notice a curious phenomena.
Forecasts for snow on December Twenty-fourths and Twenty-fifths have higher probabilities than forecasts for Twenty-sixths or Twenty-sevenths. This disparity is inverted on the Fourth of July, where probabilities for rain are lower than for the Fifth. Surely nature doesn’t have a precipitation date bias, so what is going on?
Wishcasting, that’s what.
Weathermen want white Christmases and dry Fourths just like everybody else, and their desire for these outcomes influence the forecasts they make. These professionals routinely forecast probabilities too high for Christmas and too low for the Fourth.
Wishcasting shows up everywhere: physician prognostications, particularly end-of-life judgments; stock broker picks, mostly in stocks owned by the brokers; sports betting, with a home-team bias; and presidential election guesses, where a form of the home-team bias also appears.
It’s is no small thing, either. The difference between an objective, evidence-based prediction and one made under the influence of desire can be enormous. Its presence is why Las Vegas stays in business and perhaps why there are many more John Does than Warren Buffets.
This year’s presidential election steamed a lot of collars, so I thought it would be fun to test for the presence of wishcasting in the race.
Just after the close of both Democrat and Republican conventions, I conducted a survey asking people who they thought would win, Romney or Obama, who they wanted to win, and how strongly they felt about those guesses. I also collected basic demographics.
Now, this being the internet, and people being people, the chance of fibbing, spoofing, and other forms of dishonesty when answering surveys is not trivial; but I decided, like all sociologists do, to ignore it. That’s what makes it science. I got 506 registered voters, some of whom self-labeled as conservative-leaning, others as progressive-leaning.
No special statistical training is needed to understand the results, except one thing: all probabilities (here and everywhere) are conditional on stated evidence. The chance of 6 when rolling a die is 1/6, because evidence tells us that we have a six-sided object, just one side of which is a 6. If we were geeks and instead had a twenty-sided object (he rolls to attack), the probability changes to 1/20 because the evidence changed.
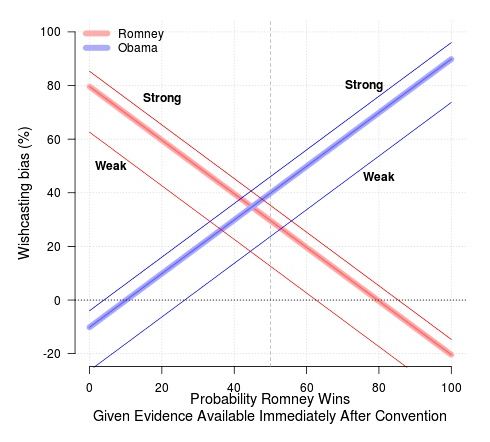
All the magic happens in this picture:
After the conventions, there was publicly available evidence, like in a stock market, which if considered would have given us the probability Romney would win.
For example, suppose the evidence implied Romney had a 50% chance. I have no idea what the true probability was, but I don’t have to. The horizontal axis in the graph ranges over all possible values this number could have been, from 0% to 100%.
It is true that Obama won the race, but that does not imply that, given the information available at the close of the conventions, the probability he would win was 100%. This would be like saying a person who guessed a six would show on the roll of a die was claiming there was 100% chance the die would show a six.
Examine only the thick red and blue lines and suppose the probability was 50% chance of a Romney win. 80% of folks who picked Romney to win wanted him to win, and 90% of people who picked Obama to win wanted him to win. But if the true Romney win probability was 50%, then Romney supporters overshot by 30%, and Obamaites by 40%. These amounts are the wishcasting bias.
The graph tracks how much wishcasting bias supporters of both men garnered (vertical axis), indexed by the true Romney win probability (horizontal axis).
For Obama fans to have no wishcasting, the true Romney win probability would have to have been 10% (where the blue line intersects 0). For Romneyons, this was 80%. Conclusion is that Obama supporters wishcast less, but still some, if we consider the true probability was likely less than 50%.
The thin red and blue lines break the data down by sureness of picks. People who were strongly sure of their picks had higher wishcasting bias than folks who were weakly sure (this is so if the true probability was greater than 10%).
Women wishcast more than men, but age didn’t seem to matter, nor did political self-labels. There’s more to this analysis than space allows, but I think we have the gist.
William M. Briggs, the Statistician to the Stars!, is a sometime Professor of Statistics at Cornell and a most-times consultant.
CLICK HERE FOR FULL VERSION OF THIS STORY