Gallup: Uninsured rate still higher than under BUSH
Not the headline you’ll see in MSM

Stop the presses: the percentage of people without health insurance has dropped in the first quarter of 2014.
But if a decline in the uninsured rate hadn’t occurred when Obamacare began, now that would have been a shock. After all, if you give Medicaid to a whole new group of people, offer subsidies to a huge number of other lower-income people, and stick everyone else with penalties for not getting insurance, it could be expected that the rate of those without health insurance would go down.
And I don’t recall (although I could be missing something) that anyone on the right was suggesting that the total rate of the medically uninsured would fail to go down as a result of Obamacare.
The real questions were and are (a) how much of a dent it would actually make in the uninsured (a figure that was probably somewhat elusive to begin with); (b) at what cost, both in money and disruption; (c) what quality of insurance would be the result; (d) what the effect on our health care system would be over time; and (e) the effect on our liberty.
But anyway, here are the stats are from Gallup. Unfortunately, I can’t find a link to the actual study, and I always prefer to look at the more complete picture, but let’s look at the chart from the summary version:
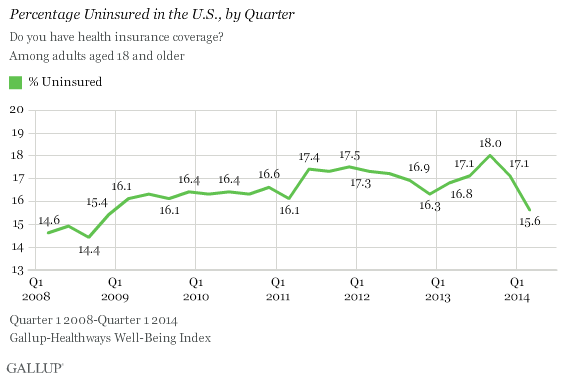
The first question I have is why the chart only begins in 2008. I did a search for a chart of earlier stats and kept getting that same chart that appears above. I’m beginning to think that Gallup may only have begun asking the question in 2008, but I just don’t know.
At any rate, as you can see, in early 2008 the uninsured rate was even lower than it is now.
What happened in late 2008 to make the rate rise? It’s pretty easy to guess: the financial downturn, which I am fairly certain had a chilling effect on the number of Americans with health insurance.
I also can’t get figures on the margin of error in the Gallup poll, but the drop here (at least in some sub-groups) may be within it. I happen to think that the overall drop is real, however. It makes perfect sense that the rate would drop, for all the reasons I wrote in that first paragraph, and I would be stunned if it had not.
Gallup also points out that by far the greatest drops occurred in the following categories: people with incomes under $36,000, and blacks. That is completely understandable and expected, as well, because it’s logical to assume that it reflects both the Medicaid expansion and the effect of subsidies (although it’s interesting that—as I’ve read in other sources—there was not a similar drop in the percentage of the uninsured among Hispanics).
Here’s the chart:
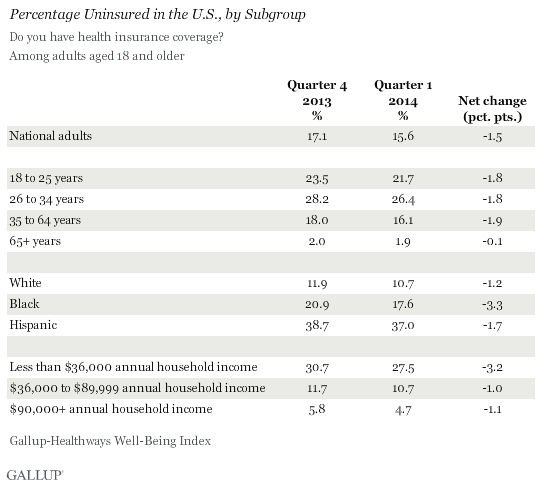
Unfortunately, the chart only compares the last quarter of 2013 to the first quarter of 2014; I would have liked to have seen it go further back in time for a fuller picture.
How much of the drop involves the Medicaid expansion? How much the fact that the unemployment rate (at least, in the flawed way it’s measured) also dropped between the last quarter of 2013 and the first quarter of 2014? How many of the newly-covered people will continue to be covered a few months from now, and how many will end up defaulting on their payments?
And what are the answers to my questions in paragraph one?
[Neo-neocon is a writer with degrees in law and family therapy, who blogs at neo-neocon.]
 DONATE
Donations tax deductible
to the full extent allowed by law.


Comments
And how do they define “covered”? If it’s like the administration, just visiting the website is a “sign-up” then it’s beyond meaningless – approaching the level of being intentional propaganda. It sounds like Gallup is using the bogus 7.1 million figure, too, which we all know does NOT reflect those with paid, actual health insurance coverage and includes the Medicaid increases that are NOT ObamaCare.
As you say, without more of the details, this is not very reliable or believable as to true coverage increases, even given your first statements of why this should not be surprising. Huge grain of salt with this one!
For starters, the administration cooks the books on their released numbers for *everything* under the sun, so we can’t even draw conclusions until the “unexpected” corrections are released, and possibly not even then. I’m certain the numbers before 2008 are available, but I don’t speak the dialect of High Statistician needed to interpret them into a graph over the last twenty or thirty years. (Whatever they are, I’ll bet if we feed them into Michael Mann’s AGW formula, we would get a hockey stick… but I digress)
Much like the unemployment numbers, which are less important than the “Total full-time employed compared to the total workforce” numbers (Can’t remember the phrase for that), the number we should be looking at here is “Total number of people with paid private health insurance PLUS the number of people voluntarily without for their own reasons, compared to the whole population.”
I’ll bet that number is “unexpectedly” down since 2008, by a lot.
““Total full-time employed compared to the total workforce” numbers (Can’t remember the phrase for that) … ”
U6
No, no…THAT’s just unpossible.
Why, the seas are lower, too, right…???
Crazy wingnuts will believe anything.
Those graphs are raaaaaacist…!!!
It might be useful to compare the overall drop in number of insured to the unemployment rate, still burgeoning under obastard’s dictatorship. When people get laid off, they can get COBRA coverage for a limited period – if they can afford it.
Oops, meant to add that in 2008, a year prior to obastard taking office, a higher percentage of people were employed in full-time positions that included health coverage. As obastard’s policies have leached jobs from an economy he has determined must fail, people have not found jobs that provide coverage at all, millions are still completely unemployed, and their COBRA coverage has terminated for one reason or another.
Millions of people who were formerly able to pay the whole cost of their own insurance or were getting it as part of their employment compensation have been reduced to getting (more expensive, lower-quality) insurance subsidized or entirely paid by money the government extracts from other people’s pockets.
In Democrat-think, that’s “progress.”
What kind of actual medical care they might receive with their “coverage” seems hardly to have entered into Democrat-think at all.
% of uninsured has been 16% +/- 2% for 30+ years. Nuthin’ to see here.
So we are talking about a less than 4% fluctuation, probably within the margin of error.